Q3 2019 Highlights
(unless other noted, all financial amounts in this news release are expressed in U.S. dollars)
- $102.6 million in revenue
- Net income of $4.1 million, or $0.10 per share
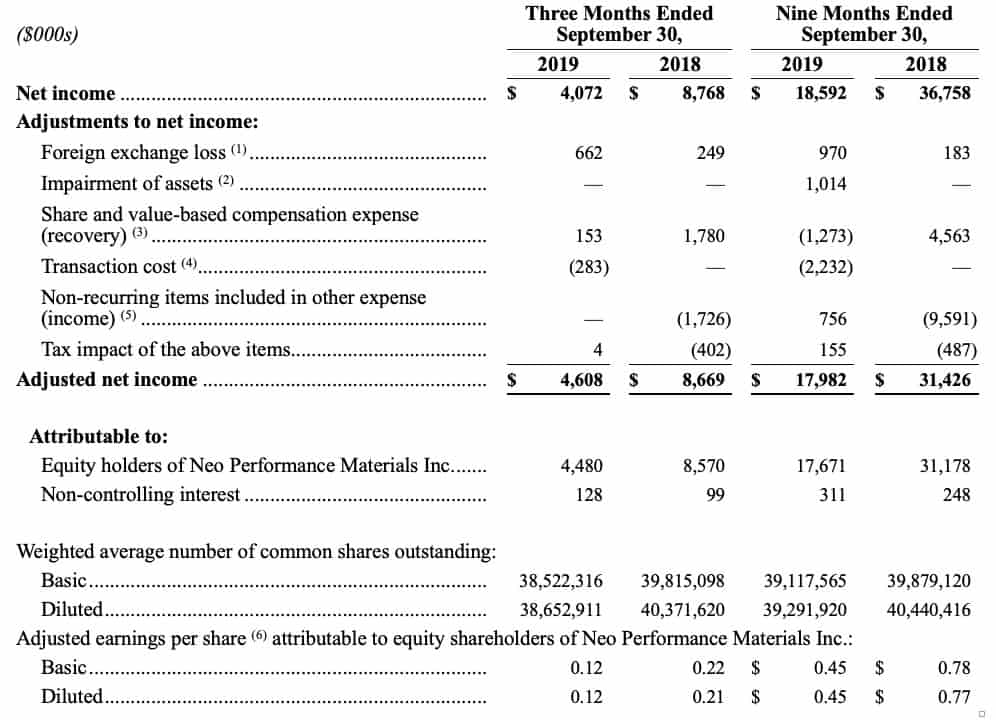
- Adjusted Net Income(1) of $4.6 million, or $0.12 per share
- Adjusted EBITDA(1) of $12.8 million
- Quarter-end closes with $74.9 million of net cash after paying $2.9 million in dividends to the shareholders and following the Company’s $9.7 million acquisition, of Anhui Asia Magnets Co., Ltd (“SAMAG“) in August 2019
- A quarterly dividend to Cdn$0.10 per common share was declared on November 12, 2019 for shareholders of record at December 20, 2019, with a payment date of December 30, 2019.
TORONTO, Canada, November 14, 2019 – Neo Performance Materials Inc. (“
Neo“, the “
Company“) (
TSX:NEO), a global leader in the innovation and manufacturing of rare earth and rare metal-based functional materials, today released its third quarter 2019 financial results. The financial statements and management’s discussion and analysis (“
MD&A“) of these results can be viewed on Neo’s web site at
www.neomaterials.com and on SEDAR at
www.sedar.com.
HIGHLIGHTS OF Q3 2019 CONSOLIDATED PERFORMANCE
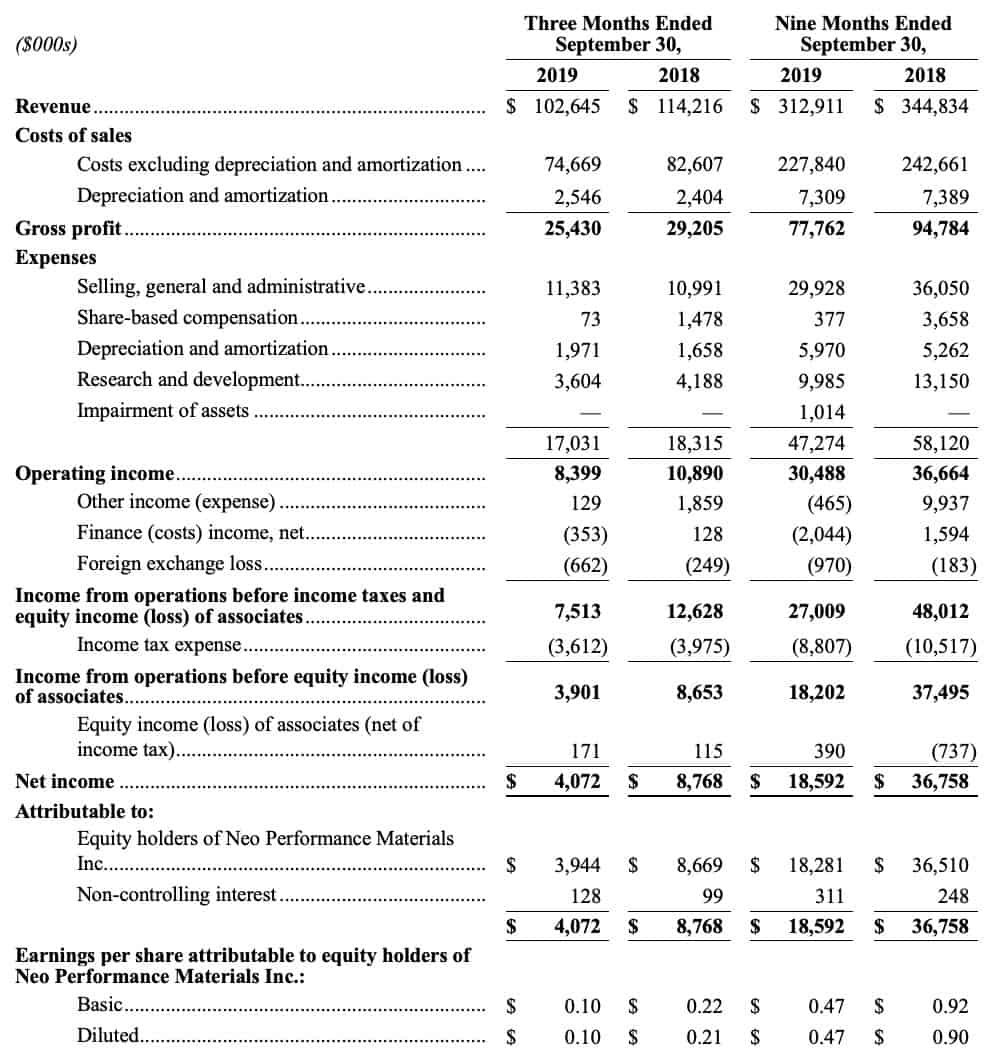
In the third quarter of 2019, Neo generated $102.6 million in revenue, compared to $114.2 million in Q3 2018; a decrease of $11.6 million or 10.1%. Net income totaled $4.1 million, or $0.10 per share. Adjusted Net Income
(1) totaled $4.6 million, or $0.12 per share.
For the nine months ended September 30, 2019, consolidated revenue was $312.9 million compared to $344.8 million for the same period in the prior year; a decrease of $31.9 million or 9.3%. Net income totaled $18.6 million, or $0.47 per share. Adjusted Net Income
(1) totaled $18.0 million, or $0.45 per share.
In the third quarter, Neo further strengthened its financial position, reporting cash and cash equivalents of $74.9 million as of September 30, 2019, compared to $71.0 million as at December 31, 2018, after paying $8.6 million in dividends to its shareholders in the nine months ended September 30, 2019, re-purchasing $13.2 million of stock under its Normal Course Issuer Bid Program, and completing a $9.7 million acquisition of SAMAG in August 2019. Neo has approximately $6.0 million available under its credit facilities with no amount drawn from the revolving line of credit.
SELECTED FINANCIAL RESULTS
| TABLE 1: Selected Consolidated Results |
|
Quarter-over-Quarter Comparison |
Year-over-Year (“YoY”) Comparison |
|
Q3 2019 |
Q3 2018 |
Q3 2019 |
Q3 2018 |
| Volume (tonnes) |
3,131 |
3,649 |
10,228 |
10,644 |
| ($000s) |
|
|
|
|
| Revenue |
$102,645 |
$114,216 |
$312,911 |
$344,834 |
| Operating income |
$8,399 |
$10,890 |
$30,488 |
$36,664 |
| EBITDA(1) |
$12,554 |
$16,677 |
$42,722 |
$58,332 |
| Adjusted EBITDA(1) |
$12,786 |
$16,732 |
$41,276 |
$53,878 |
| Adjusted EBITDA %(1) |
12.5% |
14.6% |
13.2% |
15.6% |
_________________________
(1)Neo reports non-IFRS measures such as “Adjusted Net Income”, “Adjusted Earnings per Share”, “Adjusted EBITDA”, “Adjusted EBITDA Margin” and “EBITDA”. Please see information on this and other non-IFRS measures in the “Non-IFRS Measures” section of this news release and in the MD&A.
For the three and nine months ended September 30, 2019, revenues were 10.1% and 9.3% lower, respectively, than the corresponding periods of 2018. The Magnequench segment led the decline in revenues in these periods as volumes were adversely affected by slower economic activity in various regions globally, including in the automotive industry, and by lower rare earth material input costs, which are passed through to customers.
Operating income for the three and nine months ended September 30, 2019, was $8.4 million and $30.5 million, a decline of $2.5 million and $6.2 million, respectively, as compared to same periods last year. Net income for these periods also declined YoY.
Adjusted EBITDA for the three and nine months ended September 30, 2019 was $12.8 million and $41.3 million, a decrease of $3.9 million and $12.6 million from corresponding periods last year. This was driven largely by lower volumes and the timing effect of the input cost pass-through mechanic in the Magnequench segment, lower tantalum selling prices with higher inventoried costs in the Rare Metals segment, partially offset by increased spot sales and lower premium freight costs in the C&O segment.
Neo continues to forecast longer-term growth in demand for many of its key products driven by several global macro trends, including increased electrification of automobiles, which increases the need for Neo’s functional materials on a per-vehicle basis; greater demand for precision and efficient motors across multiple sectors, which encourages higher utilization of Neo’s magnetic materials; growth in hybrid and electric vehicles; more stringent government regulation with respect to air and water emissions; and trends toward greater utilization of lighter-weight materials in industries such as aerospace and consumer electronics. Neo’s functional materials are integral to technologies in all these end markets.
MAGNEQUENCH SEGMENT RESULTS
| TABLE 2: Selected Magnequench Results |
|
Quarter-over-Quarter Comparison |
Year-over-Year Comparison |
|
Q3 2019 |
Q3 2018 |
Q3 2019 |
Q3 2018 |
| Volume (tonnes) |
1,385 |
1,601 |
4,197 |
4,682 |
| ($000s) |
|
|
|
|
| Revenue |
$42,024 |
$54,539 |
$131,052 |
$166,502 |
| Operating income |
$6,135 |
$10,514 |
$21,780 |
$35,287 |
| EBITDA(1) |
$8,109 |
$12,265 |
$27,653 |
$40,854 |
| Adjusted EBITDA(1) |
$8,324 |
$12,549 |
$27,508 |
$41,432 |
_________________________
(1)Neo reports non-IFRS measures such as “Adjusted Net Income”, “Adjusted Earnings per Share”, “Adjusted EBITDA”, “Adjusted EBITDA Margin” and “EBITDA”. Please see information on this and other non-IFRS measures in the “Non-IFRS Measures” section of this news release and in the MD&A.
For the three and nine months ended September 30, 2019, volumes decreased by 13.5% and 10.4%, respectively, compared to the same periods in the prior year. Revenues were down $12.5 million and $35.5 million compared to the corresponding periods in 2018 due to lower volumes and lower rare earth commodity prices in 2019. Neo passes through these material input cost changes to most of its customers on a lagged basis.
Volumes in the Magnequench segment decreased YoY, mostly in its legacy and longer running programs, due to the slowdown in auto sales, slower economic performance in certain sectors, and anticipated customer inventory adjustments. Magnequench is experiencing growth-related to newer products such as traction motors for hybrid and electric vehicles, and anticipates growth in other programs that are still ramping up volumes to full production levels. Magnequench is benefiting from growth in the precision and efficient motors and the increased utilization of its magnetic materials on a per-vehicle basis, a continuing growth trend driven by a larger global macro trend toward increasing electrification of various vehicle systems.
Adjusted EBITDA was $8.3 million and $27.5 million for the three and nine months ended September 30, 2019, compared to $12.5 million and $41.4 million in the corresponding periods last year. Adjusted EBITDA was affected by lower volumes (both in margin and overhead absorption), changes in foreign exchange rates, as well as timing impacts from Neo’s input cost pass-through mechanics. This pass-through mechanic, which updates selling prices on a lagged basis, generally monthly and quarterly, is a key feature of Neo’s strategic focus on value-add margins. Higher rare earth selling prices were passed through to customers in late 2017 and into 1H of 2018, while pass-through pricing was relatively stable in 2H 2018 and generally declined through 2019.
On August 26, 2019, Neo announced that it had completed the previously announced acquisition of the assets of SAMAG, a privately-owned manufacturer of compression molded neodymium-iron-boron bonded magnets. Among the assets acquired is a new production facility in Chuzhou, China (west of Shanghai), built in 2016 and recently enhanced by a US$2.9 million capacity expansion, including the installation of new manufacturing equipment and additional production footprint. This acquisition will allow Neo’s Magnequench business unit to accelerate its strategy to expand into compression molded magnet production.
On October 16, 2019, Neo Magnequench’s facility in Tianjin, China was named as a “Top 100” manufacturing enterprise in Tianjin by the Tianjin Enterprise Association because of the plant’s sustained net profitability, cutting-edge research and development programs, and continuous improvements made to operational efficiency and employee development.
CHEMICALS AND OXIDES (“C&O”) SEGMENT RESULTS
| TABLE 3: Selected C&O Results |
|
Quarter-over-Quarter Comparison |
Year-over-Year Comparison |
|
Q3 2019 |
Q3 2018 |
Q3 2019 |
Q3 2018 |
| Volume (tonnes) |
1,713 |
1,985 |
5,901 |
5,768 |
| ($000s) |
|
|
|
|
| Revenue |
$42,469 |
$41,361 |
$124,576 |
$123,215 |
| Operating income |
$5,134 |
$3,908 |
$15,456 |
$9,833 |
| EBITDA(1) |
$6,492 |
$4,995 |
$19,152 |
$13,209 |
| Adjusted EBITDA(1) |
$6,543 |
$5,214 |
$18,455 |
$13,914 |
_________________________
(1)Neo reports non-IFRS measures such as “Adjusted Net Income”, “Adjusted Earnings per Share”, “Adjusted EBITDA”, “Adjusted EBITDA Margin” and “EBITDA”. Please see information on this and other non-IFRS measures in the “Non-IFRS Measures” section of this news release and in the MD&A.
For the three months ended September 30, 2019, volumes decreased YoY by 13.7%, while year-to-date volumes increased 2.3% compared to the same period in the prior year. Q3 2019 revenue increased to $42.5 million, from $41.4 million in Q3 2018, and rose to $124.6 million in the nine months ended September 30, 2019 from $123.2 million in the corresponding period of 2018.
In the nine months ended September 30, 2019, three-way auto catalyst volumes have continued to show incremental YoY growth despite a general slowdown in automotive markets throughout the year. However, this was offset by a decline in diesel catalyst products. With declining diesel volumes in the past several quarters, overall product mix between three-way and diesel catalysts for Neo is now more reflective of market mix considerations. The C&O segment did not incur premium freight costs in 2019, as opposed to $4.2 million of premium freight costs incurred in 2018.
In C&O’s rare earth separation business, the continuing decline of many of the rare earth commodity prices have led to a lagging impact of higher-cost inventory relative to current selling prices, and this has had a negative impact of margins for rare earth separation in the three and nine months ending September 30, 2019. This was partially mitigated by a strong increase in prices for certain heavy rare earth elements primarily Dysprosium and Terbium, which led to stronger margins for the heavy rare earth separation business in the three months ended September 30, 2019. In addition, C&O has benefited from increased spot sales in the three and nine months ended September 30, 2019 compared to 2018.
RARE METALS SEGMENT RESULTS
| TABLE 4: Selected Rare Metals Results |
|
Quarter-over-Quarter Comparison |
Year-over-Year Comparison |
|
Q3 2019 |
Q3 2018 |
Q3 2019 |
Q3 2018 |
| Volume (tonnes) |
134 |
149 |
406 |
423 |
| ($000s) |
|
|
|
|
| Revenue |
$22,500 |
$22,388 |
$69,058 |
$66,480 |
| Operating (loss) income |
$(155) |
$501 |
$(369) |
$4,140 |
| EBITDA(1) |
$946 |
$1,710 |
$3,088 |
$7,803 |
| Adjusted EBITDA(1) |
$963 |
$1,784 |
$3,951 |
$8,052 |
_________________________
(1)Neo reports non-IFRS measures such as “Adjusted Net Income”, “Adjusted Earnings per Share”, “Adjusted EBITDA”, “Adjusted EBITDA Margin” and “EBITDA”. Please see information on this and other non-IFRS measures in the “Non-IFRS Measures” section of this news release and in the MD&A.
For the three and nine months ended September 30, 2019, Rare Metals increased revenues by 0.5% and 3.9%, respectively, driven primarily by increases in hafnium product sales as the business continues to generate additional demand from both new and existing customers. This was offset by the continued decline in pricing for tantalum-based products, which impacted the segment because of higher-cost inventoried material. The Rare Metals segment continues to develop new products and focus on value-added margins to mitigate short-term variations in its earnings due to material price volatility.
CONFERENCE CALL ON THURSDAY, NOVEMBER 14, 2019 AT 10 AM EASTERN
Management will host a teleconference call on Thursday, November 14, 2019 at 10:00 a.m. (Eastern Time) to discuss the third quarter 2019 results. Interested parties may access the teleconference by calling (647) 427-7450 (local) or (888) 231-8191 (toll-free long distance) or by visiting https://cnw.en.mediaroom.com/events. A recording of the teleconference may be accessed by calling (416) 849-0833 (local) or (855) 859-2056 (toll-free long distance), and entering pass code 7074462# until December 14, 2019 or by visiting https://cnw.en.mediaroom.com/events.
NON-IFRS MEASURES
This news release refers to certain non-IFRS financial measures such as “Adjusted Net Income”, “EBITDA”, “Adjusted EBITDA”, and “Adjusted EBITDA Margin”. These measures are not recognized measures under IFRS, do not have a standardized meaning prescribed by IFRS, and may not be comparable to similar measures presented by other companies. Rather, these measures are provided as additional information to complement IFRS financial measures by providing further understanding of Neo’s results of operations from management’s perspective. Neo’s definitions of non-IFRS measures used in this news release may not be the same as the definitions for such measures used by other companies in their reporting. Non-IFRS measures have limitations as analytical tools and should not be considered in isolation nor as a substitute for analysis of Neo’s financial information reported under IFRS. Neo uses non-IFRS financial measures to provide investors with supplemental measures of its base-line operating performance and to eliminate items that have less bearing on operating performance or operating conditions and thus highlight trends in its core business that may not otherwise be apparent when relying solely on IFRS financial measures. Neo believes that securities analysts, investors and other interested parties frequently use non-IFRS financial measures in the evaluation of issuers. Neo’s management also uses non-IFRS financial measures in order to facilitate operating performance comparisons from period to period. For the operating segments, Neo also uses “OIBDA” and “Adjusted OIBDA”, which reconciles to operating income. Neo uses Adjusted OIBDA and Adjusted EBITDA interchangeably as the use of adjustments in each measure provides the same calculated outcome of operating performance. For definitions of how Neo defines such financial measures, please see the “Non-IFRS Financial Measures” section of Neo’s management’s discussion and analysis filing for the three and nine months ended September 30, 2019, available on Neo’s web site at www.neomaterials.com and on SEDAR at www.sedar.com.
TABLE 5: CONSOLIDATED STATEMENTS OF FINANCIAL POSITION
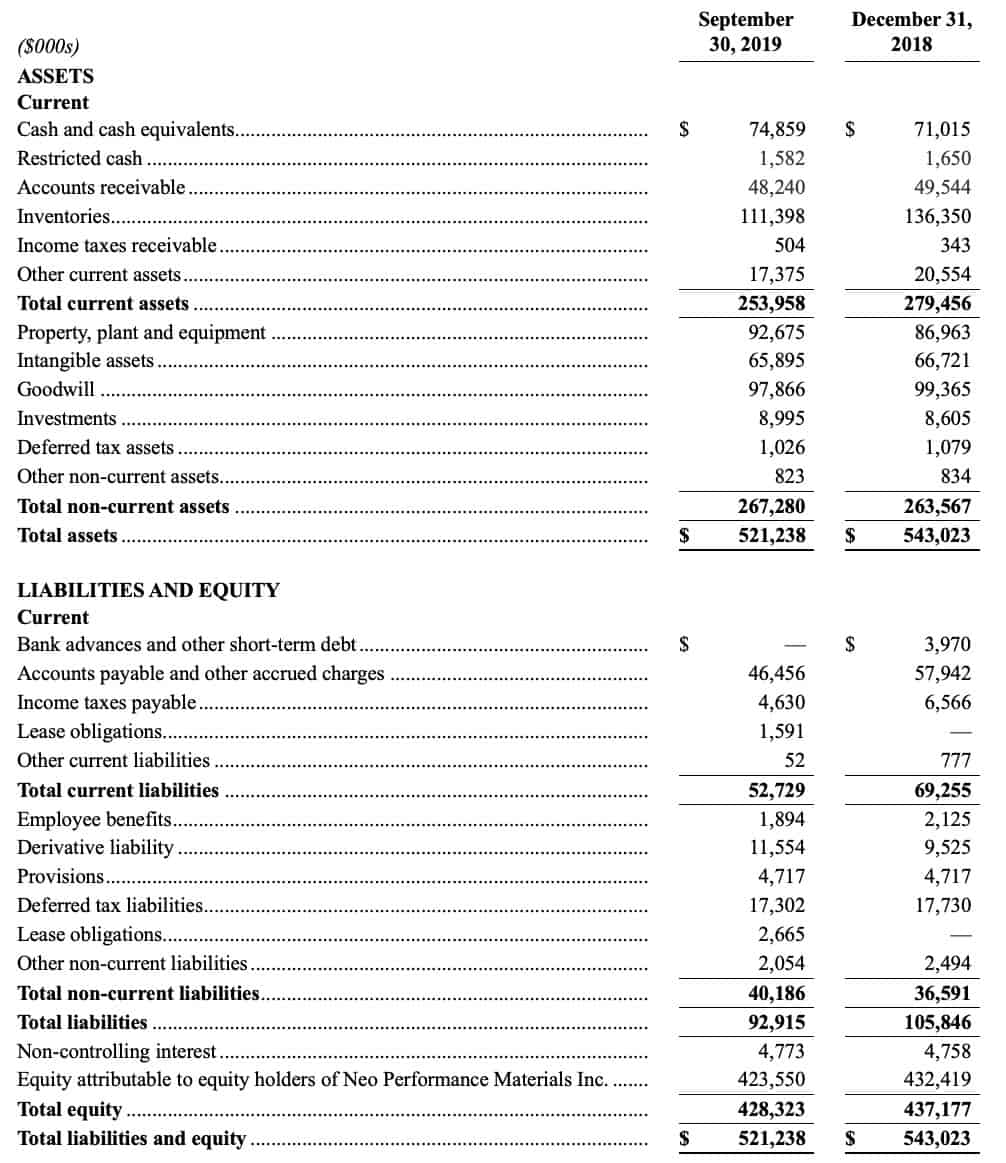 ____________________________
See accompanying notes to this table in Neo’s Interim Condensed Consolidated Financial Statements for the Three and Nine Month Periods Ended September 30, 2019, available on Neo’s website at www.neomaterials.com and on SEDAR at www.sedar.com.
TABLE 6: CONSOLIDATED RESULTS OF OPERATIONS
Comparison of the three and nine months ended September 30, 2019 to the three and nine months ended September 30, 2018:
____________________________
See accompanying notes to this table in Neo’s Interim Condensed Consolidated Financial Statements for the Three and Nine Month Periods Ended September 30, 2019, available on Neo’s website at www.neomaterials.com and on SEDAR at www.sedar.com.
TABLE 6: CONSOLIDATED RESULTS OF OPERATIONS
Comparison of the three and nine months ended September 30, 2019 to the three and nine months ended September 30, 2018:
 ____________________________
See Management’s Discussion and Analysis for the Three and Nine Month Periods Ended September 30, 2019, available on Neo’s website at www.neomaterials.com and on SEDAR at www.sedar.com.
TABLE 7: RECONCILIATION OF NET INCOME TO EBITDA, ADJUSTED EBITDA AND FREE CASH FLOW
____________________________
See Management’s Discussion and Analysis for the Three and Nine Month Periods Ended September 30, 2019, available on Neo’s website at www.neomaterials.com and on SEDAR at www.sedar.com.
TABLE 7: RECONCILIATION OF NET INCOME TO EBITDA, ADJUSTED EBITDA AND FREE CASH FLOW
 Notes:
- Represents other expenses resulting from non-operational related activities. Other income primarily relating to cost and insurance recoveries as a result of the fire at the Silmet facility. These costs and recoveries are not indicative of Neo’s ongoing activities.
- Represents unrealized and realized foreign exchange losses (gains) that include non-cash adjustments in translating foreign denominated monetary assets and liabilities.
- The $1.0 million impairment in the Rare Metals division represents impairment of property, plant and equipment and other assets related to the closure of NRM Utah that will not be utilized as a result of the closure.
- Represents share and value-based compensation expense in respect of the Legacy Plan, the LTIP and the long-term value bonus plan, which has similar vesting criteria to the share-based plan and is settled in cash for non-executives and non-North Americans where implementation of a share settlement plan would have been prohibitively expensive in terms of administration and compliance. Value-based compensation expense/(recovery) of $79 and $(1,651) are included in selling, general, and administration expenses for the three and nine months ended September 30, 2019, respectively, and expense of $302 and $905 are included for the three and nine months ended September 30, 2018, respectively. Neo has removed both the share and value-based compensation expense from EBITDA to provide comparability with historic periods and to treat it consistently with the share-based awards that they are intended to replace.
- These represents legal, professional advisory fees and other transaction costs incurred/(recovered) with respect to non-operating capital structure related transactions. These net recoveries were included in selling, general, and administration expense. Neo has removed these charges provide comparability with historic periods.
- Capital expenditures includes $9.7 million related to the assets acquired through a business combination.
- Calculated as Free Cash Flow divided by Adjusted EBITDA.
TABLE 8: RECONCILIATION OF NET INCOME TO ADJUSTED NET INCOME
Notes:
- Represents other expenses resulting from non-operational related activities. Other income primarily relating to cost and insurance recoveries as a result of the fire at the Silmet facility. These costs and recoveries are not indicative of Neo’s ongoing activities.
- Represents unrealized and realized foreign exchange losses (gains) that include non-cash adjustments in translating foreign denominated monetary assets and liabilities.
- The $1.0 million impairment in the Rare Metals division represents impairment of property, plant and equipment and other assets related to the closure of NRM Utah that will not be utilized as a result of the closure.
- Represents share and value-based compensation expense in respect of the Legacy Plan, the LTIP and the long-term value bonus plan, which has similar vesting criteria to the share-based plan and is settled in cash for non-executives and non-North Americans where implementation of a share settlement plan would have been prohibitively expensive in terms of administration and compliance. Value-based compensation expense/(recovery) of $79 and $(1,651) are included in selling, general, and administration expenses for the three and nine months ended September 30, 2019, respectively, and expense of $302 and $905 are included for the three and nine months ended September 30, 2018, respectively. Neo has removed both the share and value-based compensation expense from EBITDA to provide comparability with historic periods and to treat it consistently with the share-based awards that they are intended to replace.
- These represent legal, professional advisory fees and other transaction costs incurred/(recovered) with respect to non-operating capital structure related transactions. These net recoveries were included in selling, general, and administration expense. Neo has removed these charges provide comparability with historic periods.
- Capital expenditures includes $9.7 million related to the assets acquired through a business combination.
- Calculated as Free Cash Flow divided by Adjusted EBITDA.
About Neo Performance Materials
Neo Performance Materials is a global leader in the innovation and manufacturing of rare earth and rare metal-based functional materials, which are essential inputs to high technology, high growth, future-facing industries. The business of Neo is organized along three segments: Magnequench, Chemicals & Oxides and Rare Metals. Neo is headquartered in Toronto, Ontario, Canada; with corporate offices in Greenwood Village, Colorado, US; and Beijing, China. Neo operates globally with sales and production across 10 countries, being Japan, China, Thailand, Estonia, Singapore, Germany, United Kingdom, Canada, United States, and South Korea. For more information, please visit
www.neomaterials.com.
Information Contacts
Ali Mahdavi
Investor Relations
(416) 962-3300
Email:
a.mahdavi@neomaterials.com
Jim Sims
Media Relations
(303) 503-6203
Email:
j.sims@neomaterials.com
Website:
www.neomaterials.com
e-mail:
info@neomaterials.com
Cautionary Statements Regarding Forward-Looking Statements
This news release contains “forward-looking information” within the meaning of applicable securities laws in Canada. Forward-looking information may relate to future events or future performance of Neo. All statements in this release, other than statements of historical facts, with respect to Neo’s objectives and goals, as well as statements with respect to its beliefs, plans, objectives, expectations, anticipations, estimates, and intentions, are forward-looking information. Specific forward-looking statements in this discussion include, but are not limited to, the following: expectations regarding certain of Neo’s future results and information, including, among other things, revenue, expenses, sales growth, capital expenditures, and operations; statements with respect to current and future market trends that may directly or indirectly impact sales and revenue of Neo; expected use of cash balances; continuation of prudent management of working capital; source of funds for ongoing business requirements and capital investments; expectations regarding sufficiency of the allowance for uncollectible accounts and inventory provisions; analysis regarding sensitivity of the business to changes in exchange rates; impact of recently adopted accounting pronouncements; risk factors relating to intellectual property protection and intellectual property litigation; and, expectations concerning any remediation efforts to Neo’s design of its internal controls over financial reporting and disclosure controls and procedures. Often, but not always, forward-looking information can be identified by the use of words such as “plans”, “expects”, “is expected”, “budget”, “scheduled”, “estimates”, “continues”, “forecasts”, “projects”, “predicts”, “intends”, “anticipates” or “believes”, or variations of, or the negatives of, such words and phrases, or state that certain actions, events or results “may”, “could”, “would”, “should”, “might” or “will” be taken, occur or be achieved. This information involves known and unknown risks, uncertainties and other factors that may cause actual results or events to differ materially from those anticipated in such forward-looking information. Neo believes the expectations reflected in such forward-looking information are reasonable but no assurance can be given that these expectations will prove to be correct and such forward-looking information included in this discussion and analysis should not be unduly relied upon. For more information on Neo, investors should review Neo’s continuous disclosure filings that are available under Neo’s profile at www.sedar.com.